Written Commentary
MONTHLY FUTURES MARKET OVERVIEW
>>Read the full July 2024 Edition HERE
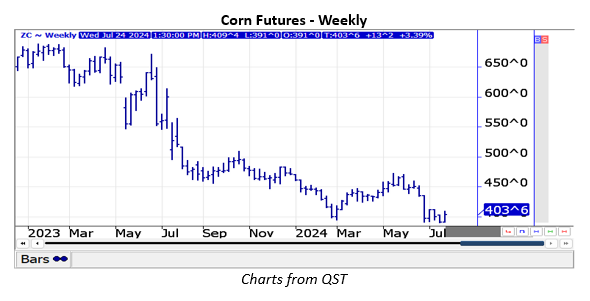
GRAINS
The USDA cut corn old crop 23/24 ending stocks 145 mil. bu. to 1.877 bil. as feed usage and exports were both raised 75 mil. bu. Stocks were 165 mil. below expectations and below the range of guesses. 2024 production at 15.10 bil. was in line with expectations, following the higher acreage data from June. As expected, there was no change to the record U.S. yield forecast at 181 bpa. New crop usage was raised 100 mil. bu. with feed usage also up 75 mil., while exports were increased 25 mil. despite the historically slow start. New crop ending stocks at just below 2.10 bil. were well below the average trade estimate of 2.30 bil. Since the USDA reports, the market seems skeptical of the USDA usage figures, noted they will have to prove themselves over time, while also anticipating higher yields down the road.
The USDA cut soybean old crop 23/24 ending stocks 5 mil. bu. to 345 mil. as imports were cut 5 mil. Stocks were in line with expectations. 2024 production at 4.435 bil. was slightly above the average trade estimate of 4.415 bil. following the slightly lower acreage data from June. As we expected, there was no change to the U.S yield forecast at 52 bpa. New crop usage was left unchanged at 4.360 bil. leaving new crop ending stocks 435 mil., which is slightly below the average trade guess. Like corn, the soybean market is already anticipating higher yields down the road, while export demand will have to prove itself over time after a historically slow start.
The USDA estimated all U.S. wheat production at just over 2.0 bil. bu., which is 95 mil. above expectations and above the range of estimates. Winter wheat production at 1.341 bil. bu. was up 46 mil. from June and 25 mil. above the average estimate. It was very close to our pre-report forecast of 1.345 bil. By class, production was HRW – 763 mil. up 37 mil., SRW – 344 mil. up 2 mil. and white – 234 mil. which was up 8 mil. Spring wheat production at 578 mil. was a whopping 53 mil. above expectations. The average yield at 53.1 bpa is well above the 10-year high of 48.6 bpa in 2020. Wheat imports in 24/25 were cut 15 mil., while demand was revised up by 35 mil. (feed up 10, exports up 25) resulting in ending stocks growing to 856 mil., if realized, is a 5-year high.
LIVE CATTLE
By June 28, 2024 U.S. federal cattle slaughter was down 728,735 head, 4.5% less than the same period in 2023. Because of the lower number of cattle slaughtered, beef prices were high, but the high prices for beef did not stop Americans from buying it. It was especially true throughout June 2024 as prices moved higher because of beef demand for the July 4th holiday. Memorial Day, July 4th and Labor Day are historically known as periods of increased beef demand.
LEAN HOGS
The lean hog market from the beginning of 2024 has had huge swings in prices, and the June 2024 lean hog contract is a good example. On January 3 as traders began the second day of new year, June 2024 lean hogs dropped to a low at $88.10, which ended up being the contract low for the contract. On reports of continued strong export demand and with U.S. cattle inventories expected to fall again in 2024, hog prices turned up and moved quickly higher. By April 10, 2024, June lean hogs rallied to $109.65, moving up $21.55 in the first quarter of 2024. However, there was a large difference between prices of cash hogs with the CME lean hog index at $89.84.
STOCK INDEX FUTURES
S&P 500 and NASDAQ futures advanced to new record highs at mid-month on the belief that the Federal Reserve may pivot to accommodation sooner rather than later. However, pressure has developed more recently in light of a series of weaker than expected corporate earnings reports, especially in the high tech area, which tended to more adversely affect NASDAQ futures.
On the data front, S&P Global flash PMIs for the U.S. showed the manufacturing sector unexpectedly contracted for the first time so far this year. The manufacturing index was 49.5 when 51.6 was expected. Existing home sales in June were 3.89 million when 4.00 million were anticipated, and new home sales were 617,000 when 640,000 were estimated.
US Dollar Index
In mid-July the U.S. dollar index declined to its lowest level since June 7 as it appears more likely that the Federal Open Market Committee may be forced to become more accommodative than many analysts had expected. The greenback weakened the most against the Japanese yen as it appears that the Bank of Japan may be increasing its key interest rate at its July 31 policy meeting, which is causing traders to unwind the long U.S. dollar – short Japanese yen carry trade.
While the U.S. Federal Reserve is likely to become accommodative this year, this bearish influence on the greenback will likely be offset by prospects of lower interest rates from other major central banks, including the European Central Bank and the Bank of England.
EURO CURRENCY
There was pressure on the euro currency after weak PMI data for the euro zone, which increased expectations that the European Central Bank will lower interest rates two more times this year. The HCOB Flash euro zone Composite PMI declined to 50.1 in July 2024, which is well under forecasts of 51.1.
CRUDE OIL
September crude oil futures peaked on July 5 and have steadily marched lower. Increasing prospects of a global economic slowdown pressured prices. There was only a limited recovery when EIA data showed a decrease of 3.741 million barrels last week, which marked the fourth consecutive week of declines and exceeded market forecasts of a 2.05 million barrel draw.
There was downward pressure on prices due to renewed optimism about ceasefire negotiations between Israel and Hamas, while there was some support for crude oil futures due to the risk of short term supply disruptions In light of wildfires in Canada that are threatening over 10% of the region’s crude oil production.
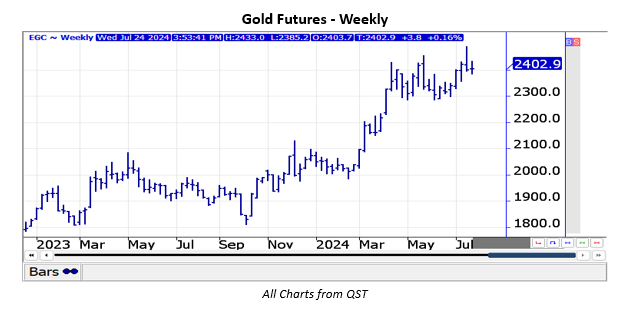
GOLD
August gold futures advanced to record highs on July 17 in light of increasing prospects of a more accommodative Federal Reserve this year. Although there is a 95% probability that the Federal Open Market Committee will keep its fed funds rate unchanged at 5.25% to 5.50% at its July 31 policy meeting, financial futures markets are now pricing in three 25 basis point cuts in the fed funds rate this year.
There is a 95% probability that the FOMC will lower its fed funds rate by 25 basis points at its September 18 meeting. In addition, the probability of an additional rate reduction from the FOMC at the November 7 meeting is 60%, and there is a 56% chance of another 25 basis point rate cut at the December 18 meeting. Analysts anticipate several major central banks will become more accommodative this year, and some already have, which remains a bullish long term fundamental for gold prices.
Interested in more futures market commentary? Explore our Market Dashboards here.
