Written Commentary
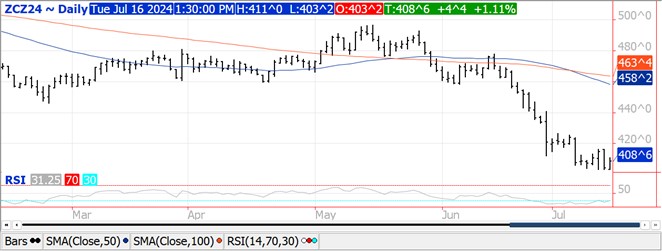
CORN
Prices were $.04-$.05 higher as Sept-24 continues to build support at $3.90, and Dec-24 just above $4.00. At some price level all the bearish news is factored in and we simply run out of sellers. Are we starting to see this in corn ? US crop ratings held steady at 68% G/E. Overall conditions remain the highest since 2020. Overall conditions improved in only 4 states while 14 saw ratings decline. Biggest increases were in ND up 7% and IL up 6%. 41% of the crop is silking ahead of 40% YA and the 5-year Ave. of 32%. 8% of the crop is in dough stage. FOB basis levels for Ukrainian corn continue to firm as their Agrarian Council suggests extreme weather this Spring and summer may cause yields to drop as much as 35%. If yields fell 30% to 5.43 mt per HA production would slip to only 21.2 mmt, the lowest in 12 years according to USDA data. This would likely limit Ukraine’s exports to only 17 mmt, down from the current USDA forecast of 24.5 mmt, shifting nearly 300 mil. bu. to other global corn suppliers. EU corn imports in the first 2 weeks of the 24/25 MY thru July 14th have reached 904k mt, up 21% from YA. Tomorrow’s EIA report is expected to show ethanol production to range from 1,050 – 1,069 tbd last week, vs. 1,054 tbd the previous week.
SOYBEANS
The soybean complex was higher across the board with spreads firming. Beans were up $.04-$.12, meal was $1-$2 higher, while oil was up 10-30. While Sept-24 carved out a new contract low, Aug-24 had an inside trading day. There remains a gap on the Aug-24 chart between $11.01 – $11.02 ½. Initial resistance for Aug-24 oil is at Friday’s high at 47.80, followed by the July high at 49.78. Next resistance for Aug-24 meal not until the 100 day MA at $349.50. Spot board crush margins slipped $.06 to $1.61 bu., no shift in PV. Temperatures across the Midwest are expected to level off at normal to slightly below normal readings thru month end. Rains over the next 7 days to favor the southern half of the Midwest with little to no rain for the northern half. ABIOVE raised their 23/24 Brazilian production forecast .7 mmt to 153.2 mmt, in step with the USDA forecast of 153 mmt and well above the Conab est. of 147.34 mmt. US soybean conditions held steady at 68% G/E and remains the highest rated crop since 2020. Ratings fell in 9 states, improved in 6 and held steady in 3. Biggest increases were NC up 8% and IL up 7%. Largest drop was in OH down 9%. 51% of the crop is blooming in line with YA and above the 5-year Ave. of 44%. 18% of crop is setting pods, above the 5-year Ave. EU bean imports thru July 14th at 349.3k mt are down 37% from YA. Their meal imports at 597.1k mt are down 24%.
WHEAT
Prices were $.04-$.05 lower in both MGEX and KC with Chicago finishing $.01-$.02 lower. New contract low for Sept-24 Chicago in early trade, however held above the spot weekly low at $5.19 ½ from March. Spot KC dipped below $5.50 for the first time since Dec-2020. New 3 ½ low for spot MGEX. Egypt’s GASC reportedly bought 770k mt of wheat with 720k coming from Russia and 50k mt coming from Bulgaria. While final pricing results aren’t currently available, Russia is believed to have had the lowest offer at $226/mt FOB for 60k mt. Jordan reportedly bought 60k mt of optional origin milling wheat for $255/mt CF for 2nd half of Aug. shipment. The original tender was for 120k mt. Japan’s Ag. Ministry is seeking just over 115k mt of US and Canadian milling wheat. US winter wheat harvest advanced to 71% slightly behind expectations and well above the 53% from YA and 5-year Ave. of 62%. Spring ratings improved 2% to 77% G/E, better than expectations. Composite ratings remain the highest since 2019. 76% of the crop is headed just below the 5-year Ave. of 78% and YA at 82%.
Charts provided by QST Charts.
>>See more market commentary here.
Risk Warning: Investments in Equities, Contracts for Difference (CFDs) in any instrument, Futures, Options, Derivatives and Foreign Exchange can fluctuate in value. Investors should therefore be aware that they may not realise the initial amount invested and may incur additional liabilities. These investments may be subject to above average financial risk of loss. Investors should consider their financial circumstances, investment experience and if it is appropriate to invest. If necessary, seek independent financial advice.
ADM Investor Services International Limited, registered in England No. 2547805, is authorised and regulated by the Financial Conduct Authority [FRN 148474] and is a member of the London Stock Exchange. Registered office: 3rd Floor, The Minster Building, 21 Mincing Lane, London EC3R 7AG.
A subsidiary of Archer Daniels Midland Company.
© 2021 ADM Investor Services International Limited.
Futures and options trading involve significant risk of loss and may not be suitable for everyone. Therefore, carefully consider whether such trading is suitable for you in light of your financial condition. The information and comments contained herein is provided by ADMIS and in no way should be construed to be information provided by ADM. The author of this report did not have a financial interest in any of the contracts discussed in this report at the time the report was prepared. The information provided is designed to assist in your analysis and evaluation of the futures and options markets. However, any decisions you may make to buy, sell or hold a futures or options position on such research are entirely your own and not in any way deemed to be endorsed by or attributed to ADMIS. Copyright ADM Investor Services, Inc.
