Written Commentary
CORN
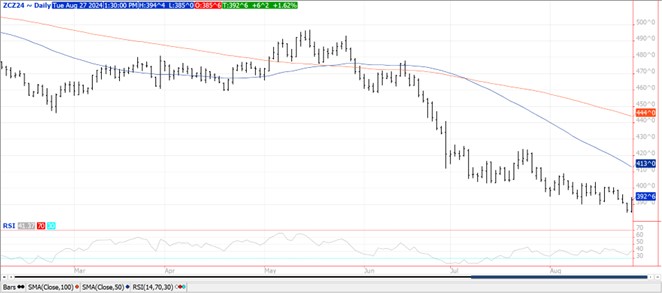
Prices were $.05-$.06 higher after both Sept-24 and Dec-24 held above yesterday’s contract lows in overnight trade. Despite the strength the Sept/Dec spread widened out to a new all-time low at $.25 ¾. First resistance for Dec-24 is at LW’s high at $4.01, followed by the August high at $4.09. The USDA announced the sale of 127.8 mmt (5 mil. bu.) of corn to Mexico. Ratings slipped 2% to 65% G/E. While overall conditions slipped to a new low for the crop season, it’s still the highest since 2018. Ratings suggest an average yield of 183.2 bpa just above the Aug-24 USDA forecast of 183.1 bpa. 84% of the crop is in the dough stage in line with recent history. 46% of the crop is dented, same as YA. and above the 5-year Ave. of 42%. 11% of the crop is mature. A number of states are reporting harvest progress led by LA at 76%, TX at 65% and MS at 46%. There is increased talk that Argentine farmers will switch as much as 2 mil. HA away from corn plantings this upcoming crop season, switching to soybeans. This would be the largest YOY change in nearly 2 decades. The lower corn acres being attributed to the leaf hopper issues that severely impacted last year’s corn yields. EU corn imports as of Aug. 23rd at 3.30 mmt are up 30% form YA.
SOYBEANS
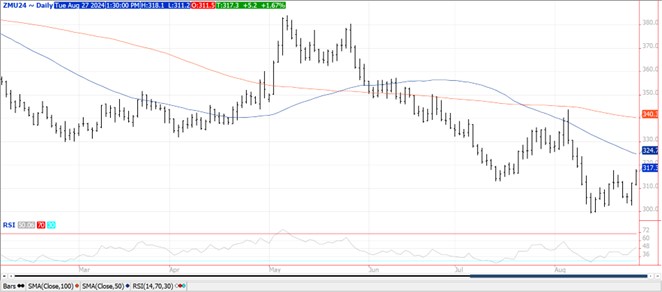
The soybean complex was mixed with beans up $.05-$.08 allowing spreads to recover, meal was $3-$5 higher, while oil was 30-50 lower. Nov-24 beans traded to a 2 week high with next resistance at $10.02 ½. Sept-24 meal also traded to a 2 week high with resistance at the 50 day MA at $324.70. Inside trading session for Sept-24 oil with resistance at 42.61. Spot board crush margins slipped $.02 to $1.83 ½ with bean oil PV drifting back to 39.3%. Cooler conditions in the northern plains will gradually drift south bringing normal to below normal readings across the nation’s midsection by Labor Day weekend. Healthy rains overnight across central MN with spottier coverage in the WCB as storms fire along the NW periphery of high pressure ridge. Rains over the next week to favor W. TX and Delta region along with the NC Midwest. Spottier coverage in the ECB with little to no moisture for the far WCB and northern plains. The first week of Sept. leans toward a cooler, dryer outlook for the central Midwest. Bean conditions slipped 1% to 67% G/E in line with expectations while maintaining their highest level since 2020. Current ratings suggest an average yield of 53.9 bpa, vs. the USDA Aug-24 est. of 53.2 bpa. 89% of crop is setting pods, in line with recent history. 6% is dropping leaves vs. YA and 5-year Ave. of 4%. LA is reporting harvest at 17% complete with MS at 7%. The head of China’s COFCO in Brazil expects their 24/25 soybean acres to expand on 1 mil. HA to 47 mil. HA, a 2.2% jump and the slowest rate of growth in 8 years. EU soybean imports as of Aug. 23rd at 1.77 mmt are down 19% from YA while their meal imports at 2.78 mmt are up 12%. Stats Canada will update their production estimates tomorrow at 7:30 am CST. Canola production is expected to reach 19.22 mmt up from 18.33 mmt YA. Estimates range from 17.8-20.4 mmt. The market seems to be quickly distancing itself from the huge production est. from Pro Farmer last Friday as lower ratings and less than ideal finishing weather in the US will likely prevent yields from reaching their full potential.
WHEAT
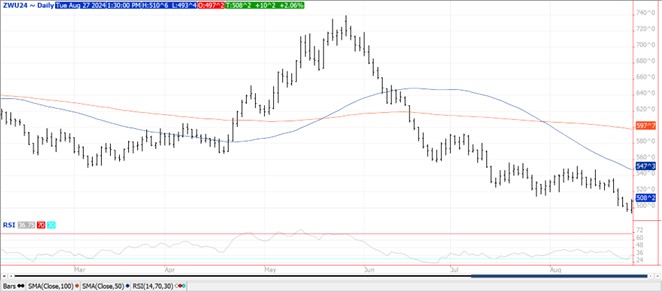
Prices were higher across all 3 classes today rejecting the lower trade overnight. KC was the upside leader posting gains of $.09-$.14. Chicago was up $.09-$.11 while MGEX was $.05-$.06 higher. After trading to new contract low for the 4th consecutive session, Sept-24 Chicago posted a key reversal day. Next resistance is LW’s high at $5.36 ½. Next major resistance for Sept-24 KC is the 50 day MA at $5.64 ¼. Next major resistance for Sept-24 MGEX is $6.00, close to this month’s high and its current 50 day MA. Jordan reportedly bought 60k mt of HRW wheat at $254.50/mt CF for Oct-24 shipment. Spring wheat ratings fell 4% to 69% G/E, vs. expectations for holding steady. Overall ratings have now dropped slightly below 2022. Current conditions suggest an average yield of 51.1 bpa, vs. the USDA est. of 52.6. 51% of the crop is harvested vs. 50% YA and the 5-year Ave. of 53%. EU Soft wheat exports as of Aug. 23rd at 3.93 mmt are down 21% from YA. Stats Canada is expected to report all wheat production at 35.13 mmt, up from 31.95 mmt YA. Estimates range from 32-37 mmt.
Charts provided by QST Charts.
>>See more market commentary here.
Risk Warning: Investments in Equities, Contracts for Difference (CFDs) in any instrument, Futures, Options, Derivatives and Foreign Exchange can fluctuate in value. Investors should therefore be aware that they may not realise the initial amount invested and may incur additional liabilities. These investments may be subject to above average financial risk of loss. Investors should consider their financial circumstances, investment experience and if it is appropriate to invest. If necessary, seek independent financial advice.
ADM Investor Services International Limited, registered in England No. 2547805, is authorised and regulated by the Financial Conduct Authority [FRN 148474] and is a member of the London Stock Exchange. Registered office: 3rd Floor, The Minster Building, 21 Mincing Lane, London EC3R 7AG.
A subsidiary of Archer Daniels Midland Company.
© 2021 ADM Investor Services International Limited.
Futures and options trading involve significant risk of loss and may not be suitable for everyone. Therefore, carefully consider whether such trading is suitable for you in light of your financial condition. The information and comments contained herein is provided by ADMIS and in no way should be construed to be information provided by ADM. The author of this report did not have a financial interest in any of the contracts discussed in this report at the time the report was prepared. The information provided is designed to assist in your analysis and evaluation of the futures and options markets. However, any decisions you may make to buy, sell or hold a futures or options position on such research are entirely your own and not in any way deemed to be endorsed by or attributed to ADMIS. Copyright ADM Investor Services, Inc.
