Written Commentary
CORN
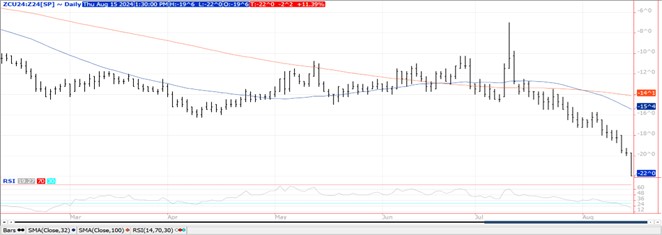
Prices drifted into new lows on the close settling $.02-$.06 lower. Sept/Dec closed at a $.22 difference, the widest since the housing crisis in 2008. Support for Sept-24 is at Monday’s contract low at $3.72 ½ with resistance at the 50 day MA at $3.92 ¼. Similar story with Dec-24 between $3.90 and $4.08. The Rosario GE increased their estimate for Argentina’s 23/24 crop by 1.5 mmt, to 49 mmt very close to the USDA forecast of 50 mmt. This afternoon the BAGE kept their forecast unchanged at 46.5 mmt. Harvest is estimated at 98% complete. US exports at 37 mil. bu. (5 mil. – 23/24 MY, 32 – 24/25) were in line with expectations. Old crop commitments at 2.197 bil. are up 38% from YA vs. the revised USDA forecast of up 35%. Shipments are up 34%. New crop sales at 261 mil. bu. are still the lowest since 2019 while representing 11.5% of the USDA forecast, behind the historical average of 17.5%. Mexico was a buyer of just over 10 mil. bu. of new crop while there nearly 14 mil. bu. sold to unknown. The last time old crop stocks were higher than now was 2020 when stock/use was at 13.7% vs. the current 12.6%. Sept corn bottomed out in early Aug-20 just above $3.05 before rallying to $3.50 by month end as late season storms ravaged what was likely record yielding crops in eastern IA and NW IL. By the following spring spot corn prices were over $7.50 as drought gripped much of Brazil while China was aggressively buying US corn.
SOYBEANS
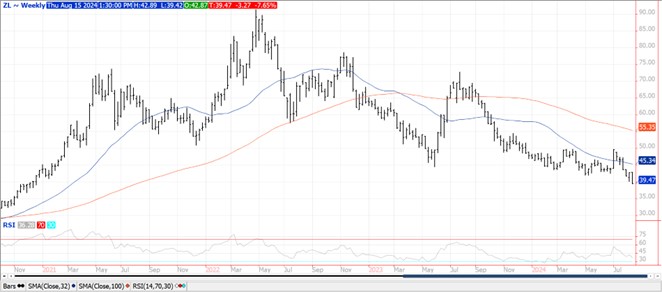
The soybean complex limped into the close settling mixed for the session. The first 4 contracts of soybeans were within a penny of unchanged with spreads widening. Meal held on to close $3-$4 higher while oil slipped into new contract lows unable to hold strength following the supportive NOPA crush report. For now Sept-24 meal has rejected trade below $300 ton from earlier this week with resistance at its 50 day MA at $323.30. Spot oil had its lowest close since Dec-2020. Good rains the past 24 hours were noted across IA, MO, Eastern KS and the northern plains. Once this rain event clears in the next 24-48 hours however, very little moisture in expected thru the end of August. Export sales at 57 mil. bu. (8 mil. – 23/24 MY, 49 – 24/25) were above expectations. Old crop commitments at 1.688 bil. are down 13% from YA vs. the USDA forecast of down 14%. Shipments are down 16%. New crop commitments at 216 mil. are still the lowest since 2019 while representing only 11.5% of the revised USDA forecast, behind the historical average of 23%. China/unknown combined to buy just over 37 mil. bu. of new crop last week. Soybean meal sales at 254k ton (1142k – 23/24 MY, 140k – 24/25) were at the low end of expectations. Old crop commitments are up 9% from YA, in line with the USDA forecast. Soybean oil sales at 1k tons were disappointing. Old crop commitments are up 72% from YA in line with the revised USDA forecast. NOPA crush in July at 182.9 mil. bu. was slightly above expectations and within the 178.5-185 mil. bu. range of estimates. This represent a record high for July and was up 4% YOY. With only 1 month’s data remaining for the 23/24 MY August crush will need to reach 170 mil. bu. in order to reach the current USDA crush forecast of 2.290 bil. bu. vs. 169 mil. in Aug-23. Bean oil stocks fell to a 7 month low at 1.499 bil. lbs. well below the average trade guess of 1.608 bil. and even below the range of estimates.
WHEAT
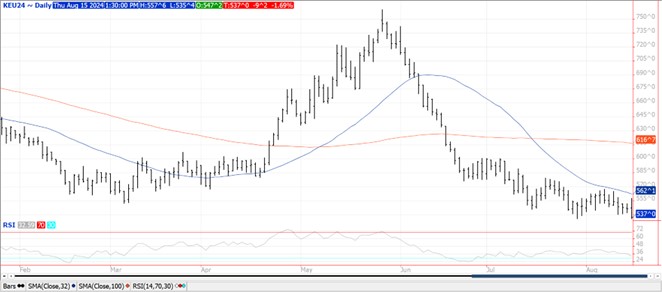
Prices finished near session lows down $.06-$.09 across all 3 classes in choppy 2 sided trade. Overnight strength largely fueled by a Russian drone strike on a Ukrainian port in Odessa wasn’t able to hold once it was determined damage was minor. Both Chicago and MGEX Sept-24 contracts challenged but couldn’t hold a test of 50 day MA, a technical level not breached since June. Sept-24 KC matched and held support at its previous contract low of $5.35 ½. Algeria is believed to have purchased around 500k mt of durum wheat at prices ranging from $328-$340/mt CF depending on the size of the shipping vessel. Most of the wheat, 275k mt, was reported sourced from Canada with shipments expected Oct thru Nov. US exports at 12 mil. bu. were in line with expectations. YTD commitments at 328 mil. are up 32% from YA, vs. the USDA forecast of up 17%. By class YTD commitments vs. the USDA forecast HRW up 68% vs. USDA up 79%, SRW down 14% vs. down 30%, HRS up 26% vs. up 9% and white up 68% vs. up 25%.
Charts provided by QST Charts.
>>See more market commentary here.
Risk Warning: Investments in Equities, Contracts for Difference (CFDs) in any instrument, Futures, Options, Derivatives and Foreign Exchange can fluctuate in value. Investors should therefore be aware that they may not realise the initial amount invested and may incur additional liabilities. These investments may be subject to above average financial risk of loss. Investors should consider their financial circumstances, investment experience and if it is appropriate to invest. If necessary, seek independent financial advice.
ADM Investor Services International Limited, registered in England No. 2547805, is authorised and regulated by the Financial Conduct Authority [FRN 148474] and is a member of the London Stock Exchange. Registered office: 3rd Floor, The Minster Building, 21 Mincing Lane, London EC3R 7AG.
A subsidiary of Archer Daniels Midland Company.
© 2021 ADM Investor Services International Limited.
Futures and options trading involve significant risk of loss and may not be suitable for everyone. Therefore, carefully consider whether such trading is suitable for you in light of your financial condition. The information and comments contained herein is provided by ADMIS and in no way should be construed to be information provided by ADM. The author of this report did not have a financial interest in any of the contracts discussed in this report at the time the report was prepared. The information provided is designed to assist in your analysis and evaluation of the futures and options markets. However, any decisions you may make to buy, sell or hold a futures or options position on such research are entirely your own and not in any way deemed to be endorsed by or attributed to ADMIS. Copyright ADM Investor Services, Inc.
