Written Commentary
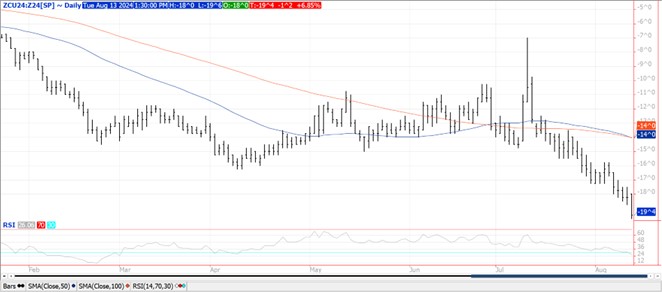
CORN
Prices were down $.04-$.05 today unable to build on yesterday’s key reversal trade. While both Sept-24 and Dec-24 held above yesterday’s contract lows, the spread between the 2 widened to a new low at $.19 ¾, the lowest spread since 2008. The USDA announced the sale of 137k mt (5.4 mil. bu.) of 2024/25 corn to Mexico. Conab lowered their Brazilian production forecast .2 mmt to 115.65 mmt, vs. the USDA est. at 122 mmt. US crop ratings held steady at 67% G/E, in line with expectations. Overall ratings remain the highest since 2020. Ratings suggest an overall US yield of nearly 184 bpa vs. the USDA update of 183.1 bpa. 60% of the crop is in dough stage same as YA and ahead of the 5-year Ave. of 56%. 18% of the crop is dented vs. 15% YA and the 5-year Ave. of 12%. Not much change in global stocks after yesterday’s USDA data.
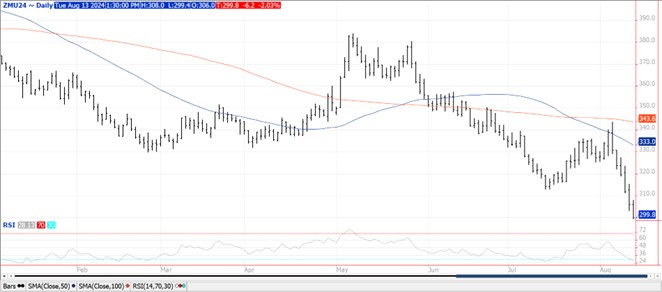
SOYBEANS
The soybean complex was lower across the board with beans down $.22-$.24 closing near session lows, meal was $5-$6 lower while bean oil was down 120 – 140. New contract lows for both Sept-24 and Nov-24 beans. Spot soybeans not in delivery have fallen below $9.50 for the first time in 4 years. New contract low for Sept-24 meal closing below $300 per ton. Support for Sept-24 oil is at last week’s contract low of 39.67. Agricultural commodities were pressured by yesterday’s neutral to bearish USDA reports and a non-threatening US weather forecast. Rainfall the balance of the week are expected to favor the central Midwest. With temperatures expected to remain seasonally mild over the next week to 10 days, record corn and soybean yields appear highly probable. Obviously the market wasn’t terribly impressed with the announced the sale of 132k mt (4.8 mil. bu.) of 2024/25 soybeans to China. Global stocks/use ratio among major exporters is forecast to rise to 22.7%, a 6 year high, however well below the 30% during the height of the trade wars with China. Soybean ratings held steady at 68% G/E however there was a 1% shift to good from excellent. Current ratings remain the highest since 2020 and suggest an average yield of just below 54 bpa, vs. the USDA update of 53.2 bpa. The USDA is forecasting record setting or matching yields in 6 of the major 18 producing states.
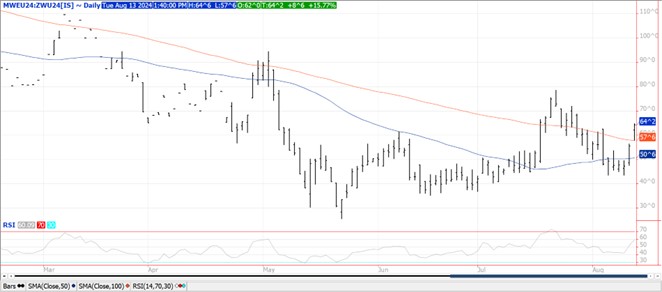
WHEAT
While wheat managed to see 2 sided trade, in the end the majority of the contracts across all 3 classes closed lower. MGEX was within a penny of unchanged, KC was $.01-$.02 lower while Chicago was down $.07-$.08. Good rains in KS the past 24 hours should help alleviate a recent uptick in drought readings. Egypt’s GASC bought only 280k mt of wheat in their recent tender for 3.8 mmt. Ukraine had the lowest offer at $244/mt FOB for 60k mt. Egypt is believed to have bought 180k mt from Ukraine and another 100k mt from Bulgaria. Given the low volume of grain purchased trade sources are suggesting Egypt is in private negotiations for a much larger purchase. Jordan reportedly bought 60k mt of optional origin HRW wheat at just under $260/mt CF for Sept. or Oct. shipment. US winter wheat harvest is winding down having reached 93%. Spring ratings fell 2% to 72% G/E, vs. expectations for a 1% drop. Overall ratings remain the highest since 2018. The updated acreage report along with current ratings suggest an average spring wheat yield of 52.3 bpa, vs. the USDA est. of 52.6. 18% of the crop is harvested vs. 20% YA and the 5-year Ave. of 21%.
Charts provided by QST Charts.
>>See more market commentary here.
Risk Warning: Investments in Equities, Contracts for Difference (CFDs) in any instrument, Futures, Options, Derivatives and Foreign Exchange can fluctuate in value. Investors should therefore be aware that they may not realise the initial amount invested and may incur additional liabilities. These investments may be subject to above average financial risk of loss. Investors should consider their financial circumstances, investment experience and if it is appropriate to invest. If necessary, seek independent financial advice.
ADM Investor Services International Limited, registered in England No. 2547805, is authorised and regulated by the Financial Conduct Authority [FRN 148474] and is a member of the London Stock Exchange. Registered office: 3rd Floor, The Minster Building, 21 Mincing Lane, London EC3R 7AG.
A subsidiary of Archer Daniels Midland Company.
© 2021 ADM Investor Services International Limited.
Futures and options trading involve significant risk of loss and may not be suitable for everyone. Therefore, carefully consider whether such trading is suitable for you in light of your financial condition. The information and comments contained herein is provided by ADMIS and in no way should be construed to be information provided by ADM. The author of this report did not have a financial interest in any of the contracts discussed in this report at the time the report was prepared. The information provided is designed to assist in your analysis and evaluation of the futures and options markets. However, any decisions you may make to buy, sell or hold a futures or options position on such research are entirely your own and not in any way deemed to be endorsed by or attributed to ADMIS. Copyright ADM Investor Services, Inc.
